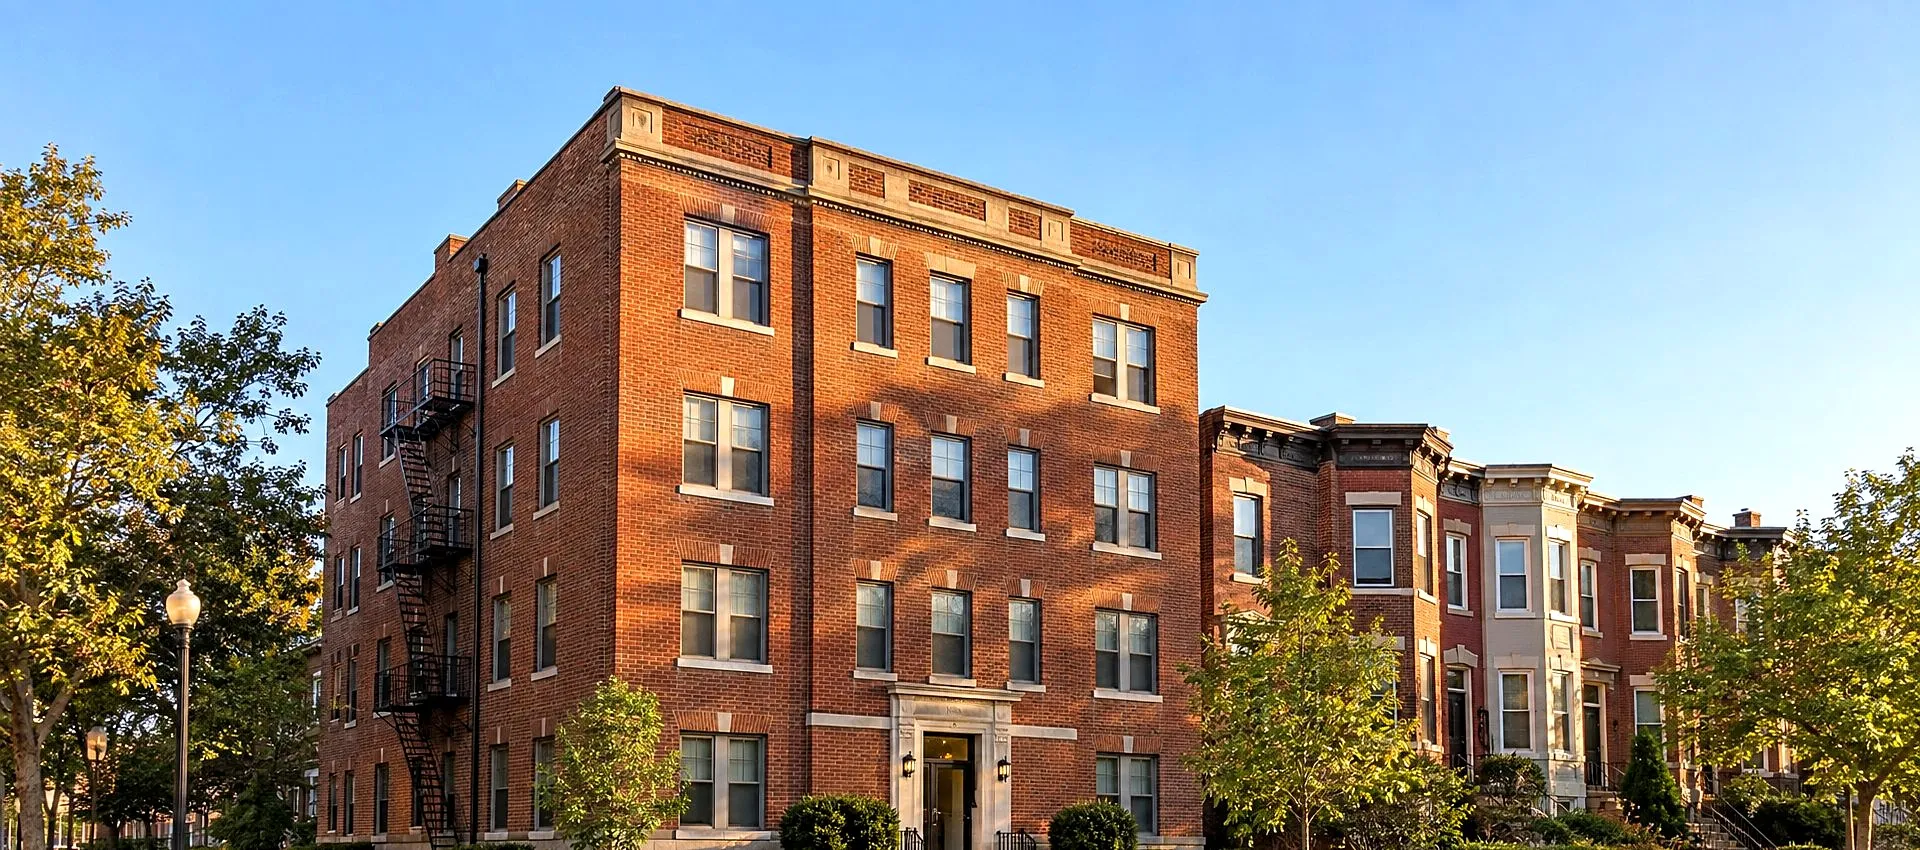
District of Columbia
Washington, DC
Data as of November 10, 2026. Source: CoStar.
Market data © CoStar, used with permission.
Eighty-five apartment buildings of 4 to 20 units sold in Washington DC from January through 10 November 2026. Of those, 84 reported a price. They sold at a median of $203,750 per unit, across a range from about $47,000 to $606,000 per unit. That spread is why a citywide average tells an owner almost nothing about a single building.
Each section below links to the full guide behind it.
The DC market in four numbers
- Price per unit. A median of $203,750 across 84 priced sales of 4- to 20-unit buildings, January through 10 November 2026.
- Cap rate. Of 341 recorded sales from 2024 through 10 November 2026, only 53 reported a cap rate. The median sat near 6.4 percent, with the middle half between about 5.3 and 7.7 percent.
- Vacancy. About 9.4 percent, unchanged since September (CoStar, 10 November 2026).
- Direction. Values have stabilised, not recovered. The median price per unit was $206,250 over the past 12 months against $200,000 the year before, and the quality-adjusted index is flat. Sales volume fell about 30 percent.
Read the full analysis: Washington DC Multifamily Market Report, November 2026
Value by neighborhood
The same unit sells for very different prices depending on where it sits. Median price per unit across 2026 DC sales, by submarket:
| Submarket | Median price per unit (2026) |
|---|---|
| Kingman Park | ~$368,000 |
| Capitol Hill | ~$325,000 |
| Foxhall | ~$310,000 |
| Dupont Circle | ~$300,000 |
| Trinidad | ~$229,000 |
| Brightwood Park | ~$206,000 |
| Langston | ~$188,000 |
| Petworth | ~$181,000 |
| Anacostia | ~$125,000 |
A unit on Capitol Hill sold for more than two and a half times a unit in Anacostia. Location sets the cap rate a buyer will accept, and the cap rate sets the value.
Read the full analysis: What Is a DC Apartment Building Worth in 2026?
What moves a DC building’s value
- Building class. Across sales since 2024, Class B buildings sold at a median of $250,386 per unit. Class C sold at $187,500, a gap of about 34 percent.
- Renovation. Renovated buildings sold at a median of $231,250 per unit, against $200,000 for buildings with no recorded renovation. That is about a 16 percent difference.
- Net operating income. At a 6.4 percent cap rate, every recurring dollar of NOI adds about $16 of value. Recover $10,000 a year, and the building is worth roughly $156,000 more.
With vacancy rising and rent stabilization limiting covered rents, the expense side is where a DC owner can still add value. Read the full analysis: How to Increase NOI on a DC Apartment Building and How to Increase NOI on a DC Class B Building in a High-Vacancy Market
Three DC rules that change the number
The Tenant Opportunity to Purchase Act (TOPA). When you sell a covered building, tenants hold a right to purchase first. That adds time and process to a DC sale that a Virginia sale does not carry. Some Maryland counties now have rent control legislation, so the county matters there. Buyers price that timing risk in. Planning the TOPA sequence early protects both your price and your closing date. Read Selling a DC Apartment Building: TOPA Timing
Rent stabilization. Many older DC buildings sit under the District’s rent-control rules, which limit how fast rents on covered units can rise. If your rents sit below market in a covered building, you cannot close that gap overnight, and a buyer knows it. That caps the optimistic end of your value range.
Lender expectations. A DC lender takes the lower of two tests: about 75 percent of appraised value, and the loan that keeps NOI at roughly 1.25 times the mortgage payment. On small DC buildings the coverage test usually controls, so your defensible NOI decides the number. Read Refinancing a DC Apartment Building: What Local Lenders Expect in 2026
Sources: CoStar, recorded DC multifamily sales of 4 to 20 units, 2024 through 10 November 2026; submarket medians use 2026 sales and submarkets with at least four sales. Vacancy from the CoStar November 2026 DC report. Price direction from remax-intel closed comps through 5 November 2026. Direction, not a precise reading of your building.
Get the number for your own building
Want the range for your building? Get a conservative, base, and optimistic value built on DC sales in your submarket, with the assumptions written out.
Run the numbers first. The NOI quick check turns your rent roll and expenses into current NOI and a value read. About five minutes.
Read the monthly report. The DMV Market Report carries the latest vacancy, rent, cap rate and value read for 4 to 20 unit buildings, with every source named.